1. Introduction
We aim to conduct an exploratory analysis and engineer new features using Python, we used the following packages: pandas; plotly; reverse geocoding and haversine. All insights, patterns and trends form the exploratory analysis are documented in this report. The data for this project will include users that have downloaded the mobileDNA application (app)in Belgium and have been active on the app for more than one month in 2022 (January to June). We were able to successfully determine the city/town, region, province, and country of each Global Position System (GPS) point in our dataset, which aided in identifying individuals who only used the mobileDNA application in Belgium. We were also able to identify how long the user had been actively using the app which aided in identifying users who had used the app for more than a month. Finally, we were able to predict the users' homes and the number of times they moved every day.
Specific focus was given to the visual representation of the GPS location data. This visual representation included visualisations of the number of mobileDNA users in each province in Belgium; top application categories used at home and outside home; sequence of smartphone application usage at home and outside home; density map outlining where user spent most of time using their smartphone and lastly, a cumulative plot showing the movement of the user in a day. The sequence of smartphone usage and the movement of user diagrams can offer us a sense of where, when, and how mobileDNA
users use their smartphones daily. The gaps in the location data recorded by the mobileDNA application is caused by the smartphone
being switched off, when the mobile is not used and inconsistence of Huawei to capture GPS data of users.
2. Methodology
The smartphone location data (GPS metadata) collected consists of the following variables: Name of application opened on the smartphone; Duration of the application usage; Receipt of message (or notification); Type of smartphone; Battery charge level; and GPS location where application was used. The first step was to create the fancyname feature, and the category features from the application feature in Table 1. The "fancyname" represents the commonly used name for an application, while the "category" represents the group to which the application belongs. Each application is uniquely classified into one category.
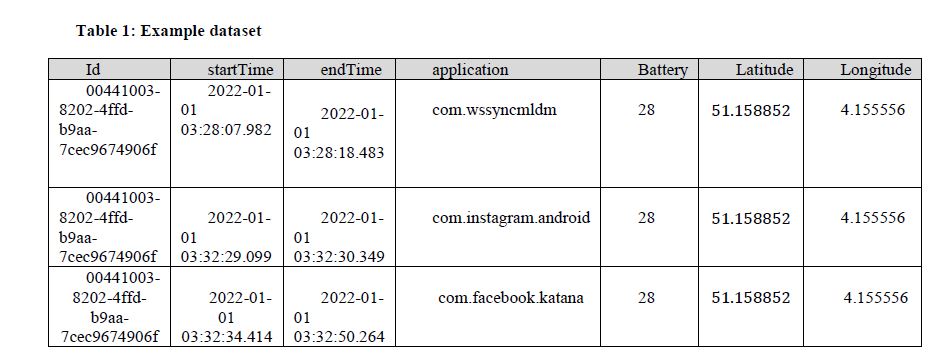
Dates were extracted from the startTime and endTime in Table 1 and labelled startDate and endDate, respectively. The month, day, and hour were then extracted from only the startTime to help in
conveniently filtering our data. Table 1’s endTime and startTime were also used to create the duration feature. We first created GPS coordinates from our dataset's longitude and latitude variables, and then used reverse geocoding in Python to derive the city, region, province, and country for each GPS coordinate.
In our location data, we engineered activation and deactivation dates from startDate and the date when the user was active for the last time. We discovered that the average time users stay on the
application was approximately 4 months.
To predict a user’s home, we assumed the users to be home between 20:00 and 08:00 in the morning the next day on weekdays. We defined home as the most frequent GPS coordinate in this period and
allowed for movement within a home.
3. Results
Applications were categorised into groups to get an overview of which group of applications is mostly used at home and outside home. We focused on the following categories: chat; gaming; social; news and magazines; and banking. chat contains applications that are more focused on sending or receiving messages such as WhatsApp; WeChat and Messenger, gaming contains applications such as lichess and puzzles, social contains applications that are more focused on posting pictures and captions such as Facebook; Instagram and LinkedIn, news and magazines category contains applications such as BBC news and lastly banking involves applications that more focused on transactions such as Google Pay; Finance Exchange and ING Smart Banking.
We can observe from Figure 1 that chat was the most used application category with an average of 361 daily users, while social was ranked fifth with an average of 282 daily users. banking category was ranked ninth with an average of 208 daily users.
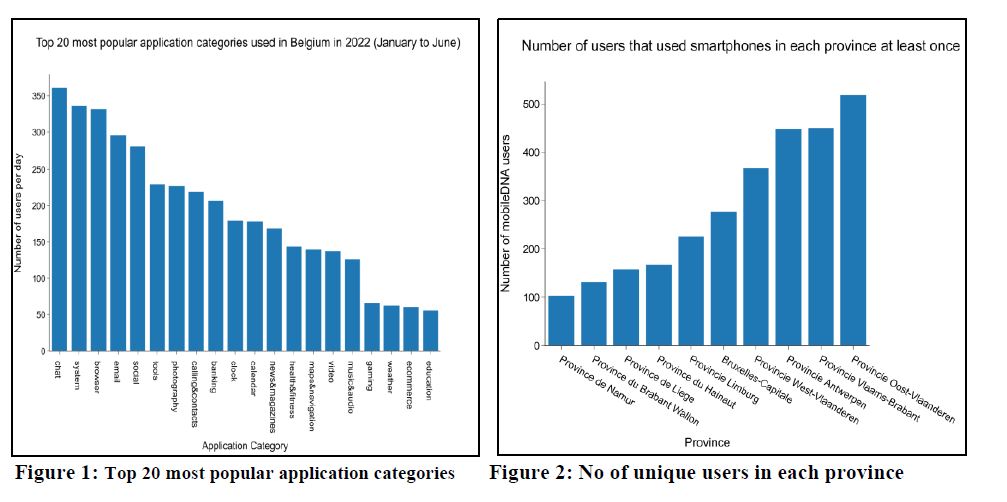
Figure 2 shows that the province of Oost-Vlaanderen had the most unique visitors (519 users), while the provinces of Hainaut, Liege, Branbant Wallon, and Namur were visited by fewer than 200 users,
with Namur being visited by the least number of users (104 users).
The average time mobileDNA users spend at home using their smartphones is 112.83 minutes per day while usage outside the home is 68.39 minutes.
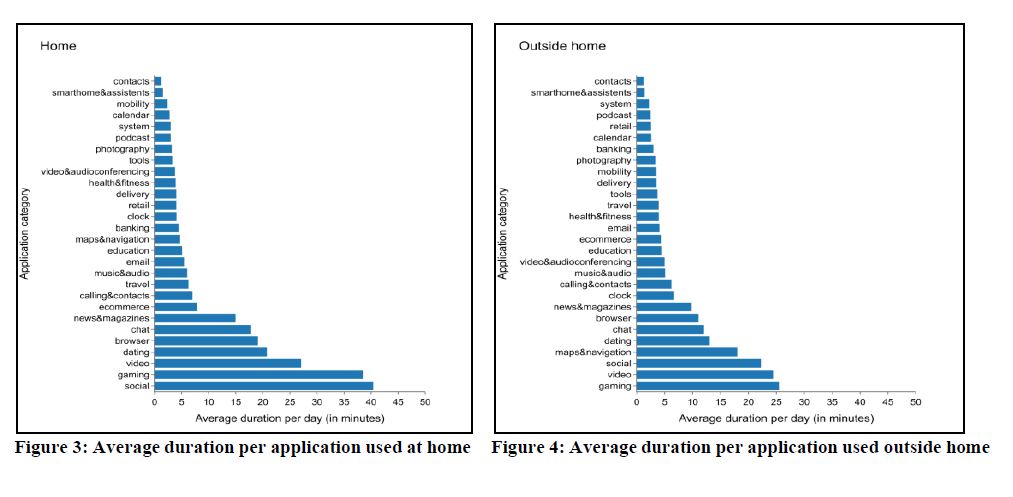
Figure 3 shows that social is the most popular application category used at home, with an average of 40.41 minutes per day, followed by the gaming application with approximately 38.49 minutes. Figure
3 also shows that the applications classified as video is ranked third with an average duration of 27.10 minutes per day, followed by dating (ranked fourth with an average duration of 20.76 minutes per day), chat (ranked sixth with an average duration of 17.83 minutes per day), and banking (ranked fifteenth with an average duration of 4.57 minutes per day).
Figure 4 shows that the two most popular application categories used outside the home are gaming (ranked first with an average duration of 25.52 minutes per day) and video (ranked second with an
average duration of 24.50 minutes). We can see that the difference in average duration between video and gaming is less than 1 minute per day. Figure 4 also shows that chat is ranked sixth with an average duration of 12.07 minutes per day, followed by news and magazines (ranked eighth with an average duration of 9.75 minutes per day) and banking (ranked twenty-second with an average duration of 3.00 minutes per day).
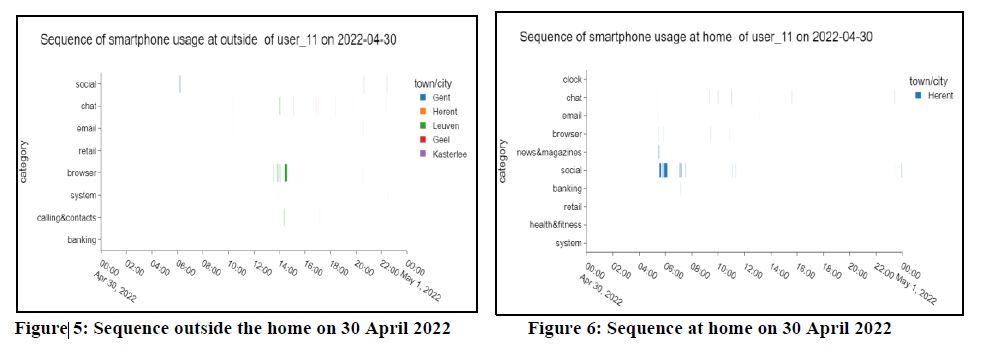
Now we will concentrate on the sequence of smartphone usage of each user, but for the purposes of this report, we will focus on user 11. Figure 5 shows that on April 30, 2022, this user visited five cities, namely, Herent, Gent, Leuven, Geel, and Kasterlee. We can also see that user 11 used their smartphone outside their home only once in the morning, then again after 12:00. Figure 5 also reveals that user 11 mostly used the browser application category between 12:00 and 16:00. User 11 utilised applications related to email, calling and contacts only once on April 30, 2022.
Figure 6 shows that user 11’s home is in the city of Herent. Figure 6 also shows that user 11 used their smartphone at home frequently between 5:00 and 6:08 and again between 7:00 and 12:00, the most utilised application categories at home on April 30, 2022, is social. user 11 also used their smartphone in Gent between 6:10 to 6:13.
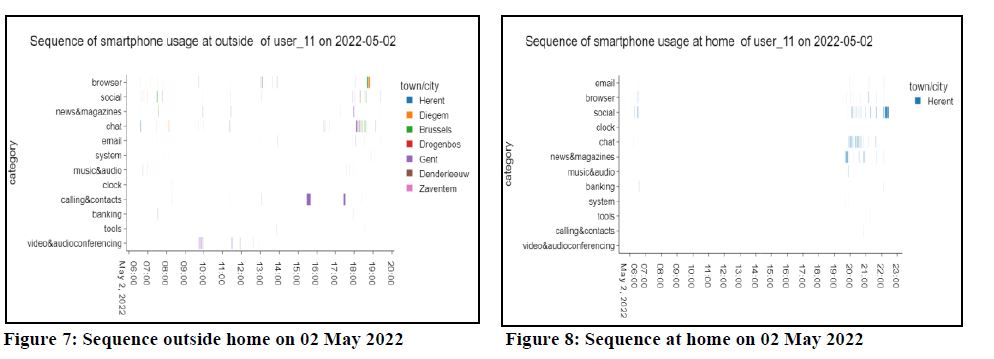
Figure 7 shows that user 11 travelled to more cities on May 02, 2022 (weekday), than on April 30, 2022. Figure 7 also shows that user 11 started using their smartphone at 06:00 and stopped using it about 20:00. On May 02, 2022, user 11 spent more time on social and chat categories. According to Figure 8, user_11 utilised their smartphone at home firstly between 06:00 and 07:00 and between 19:00 to 23:00. We can also observe from Figure 8 that the most utilised application categories at home were social; chat and news & magazines on 02 May 2022.
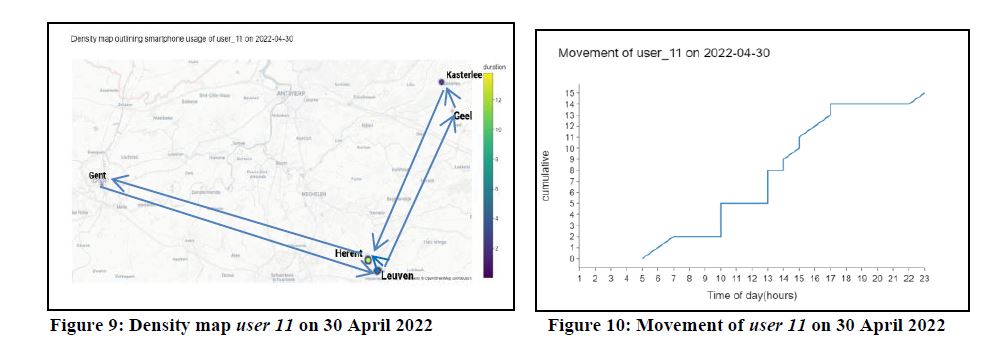
From Figure 9 we see that on 30 April 2022 user 11 spent more time on his smartphone in the cities of Herent and Leuven since the marking in these locations is yellow, indicating the longest duration
there.Figure 9 also shows that this user travelled from Herent (home) to Gent, with distance of about 82 kilometers (km) between the two cities. From Gent, the user travelled to Leuven, then to Herent, which was closer to Leuven (about 5 km between the two cities), and finally to Geel, which was about 50 km from Herent. The user travelled from Geel to Kasterlee and then back to Herent, which is home(Figure 6).
Figure 10 shows that user 11 begins traveling at 5:00 on April 30, 2022. Figure 10 also shows that the user did not move for roughly three hours between 7:00 and 10:00, then moved three times in the tenth hour and did not move again after 10:00 until 13:00. The user resumed movement from 13:00 to 17:00 and then ceased movement from 17:00 to 22:00 (as we saw from Figure 6 that user was home at this period) and finally, at 23:00, the user moved once. In total user 11 moved 15 times on this day.
4. Conclusion
Our data was successfully loaded to Python from which we were able to find the city; region; province; and country names for each GPS coordinate in the dataset using reverse geocoding package. We were able to find the distance between GPS coordinates using the haversine formula and this assisted in predicting home of users and how many times did they move per day. Using our visualisations we were able to successfully create interactive figures that can be filtered with the user and date in our Python script (Figures in Python filtered for only user 11). We were successful in predicting mobileDNA users' homes, and found that the average time spent on a smartphone at home each day 112.83 minutes which is larger than the average time spent on a
smartphone outside the home, 68.39 minutes (that is 44.44 minutes less). We also discovered that the social category was utilised more at home (40.41 minutes) than outside the home (22.29 minutes), with a difference in average time spent of around 18 minutes, which was
relatively large. The gap between the first and second most utilized application categories at home (social and gaming, respectively) was large (approximately 2 minutes) relative to the difference between the first and second application categories (gaming,video and respectively) outside of home which was around 1 minute. Because the gaming category was one of the top two most utilised categories both at home and away from home, it is interesting to note that mobileDNA users in Belgium enjoy playing games on their smartphones. chat and news and magazines categories had the highest average duration per day at home compared to outside home, whereas banking and social had higher average daily durations outside the home than at home.
Sequence of smartphone usage of a user can give us an idea of where, when and how the users use their smartphones every day. For user 11, we showed the number of places this user visited, when the user visited those cities, and which application categories were utilised in those locations by examining the sequence of smartphone usage of user 11 (Figure 5 and Figure 6). We also determined that user
11's home is in the city of Herent (Figure 6) and that this user spent more time on his smartphone at home than outside home on April 30, 2022. Figure 9, the density map can provide us with an indication of the distance between the locations mobileDNA users visited; hence, it addresses the issue of Figure 5, which simply displays the locations
visited rather than where the places are situated. Movement of a user ( Figure 10) can assist in determining the number of places users visit daily. Some the gaps in Figure 5; Figure 6; Figure 7 and Figure 8 were caused by the inactive time of the mobileDNA users (e.g. users not using their smartphones). We recommended to collect location data
every 15 minutes irrespective if the user was using their smartphone to allow more in-depth analysis of movement of users. We have discovered that most users stay on mobileDNA for roughly 4 months, with some spending less than a month. Hence, we recommend that Media, Innovation and Communication Technology at Gent University conduct a survey to understand why some users deactivate from the app. Further research is needed to cluster mobileDNA users based on GPS location and then determine whether there are any commonalities in the smartphone usage of those users. This will also help establish where the majority of mobileDNA users’ homes are situated and what time of day each location has the most users.
REFERENCES
Ali, S. M., Gupta, N., Nayak, G. K. & Lenka, R. K., 2016. Big data visualization: Tools and challenges. 2nd International Conference on Contemporary Computing and Informatic (IC3I), December pp. 656-660.
Chopde, N. R. & Nichat, M. K., 2013. Landmark based shortest path detection by using A* and Haversine formula. International Journal of Innovative Research in Computer and Communication Engineering, 1(2), pp. 298-302.
Del Rosario, M. B., Redmond, S. J. & Lovell, N. H., 2015. Tracking the Evolution of Smartphone Sensing for Monitoring Human Movement. Sensors, 15(8), pp. 18901-18933.
Do, T. M. T., Blom, J. & Gatica-Perez, D., 2011. Smartphone usage in the wild: a large-scale analysis of applications and context. In Proceedings of the 13th international conference on multimodal
interfaces, pp. 353-360.
El-Rabbany, A., 2002. Introduction to GPS: The Global Positioning System. illustrated ed. Norwood: Artech House.
Exelmans, L. & Van den Bulck, J., 2016. Bedtime mobile phone use and sleep in adults. Social Science & Medicine, 148(1), pp. 93-101. Falaki, H. et al., 2010. Diversity in smartphone usage. In Proceedings of the 8th international conference on Mobile systems, applications, and services, pp. 179-194.
Ghent University, 2017. mobileDNA - Application that shows your smartphone usage. [Online] Available at: https://www.ugent.be/mict/en/research/mobiledna [Accessed 12 10 2022].Kays, R., Crofoot, M. C., Jetz, W. & Wikelski, M., 2015. Terrestrial animal tracking as an eye on life and planet. Science, 348(6240).
Korpilo, S., Virtanen, T. & Lehvävirta, S., 2017. Smartphone GPS tracking—Inexpensive and efficient data collection on recreational movement. Landscape and Urban Planning, Volume 157, pp.
608-617.
Li, H. et al., 2015. Characterizing smartphone usage patterns from millions of android users. In Proceedings of the 2015 Internet Measurement Conference, pp. 459-472.
McKenzie, G. & Janowicz, K., 2015. Where is also about time: A location-distortion model to improve reverse geocoding using behavior-driven temporal semantic signatures. Computers, Environment and Urban Systems, Issue 54, pp. 1-13.
McKinney, W., 2015. Pandas-Powerful python data analysis toolkit. Pandas—Powerful Python Data Analysis Toolkit, Volume 1625.
Okilas, A. F., Siswanti, S. D. & Rachman, M. D., 2014. Location Based Service For Information Publication Using GPS on Android Based Mobile Phone. Proceeding of International Conference on Electrical Engineering, Computer Science and Informatics (EECSI 2014), pp. 190-197.
Oshin, T. O., Poslad, S. & Ma, A., 2012. Improving the Energy-Efficiency of GPS Based Location Sensing Smartphone Applications. 2012 IEEE 11th International Conference on Trust, Security and Privacy in Computing and Communications, pp. 1698-1705.
Wagner, D. T., Rice, A. & Beresf, A. R., 2014. Device Analyzer: Understanding smartphone usage. Mobile and Ubiquitous Systems: Computing, Networking, and Services, 1(978-3-319-11569-6), pp.
195-208.
Wisbey, B., Montgomery, P. G., Pyne, D. B. & Rattray, B., 2010. Quantifying movement demands of AFL football using GPS tracking. Journal of science and Medicine in Sport, 13(5), pp. 531-536.
Carlisle, D. (2010, April). graphicx: Enhanced support for graphics. Retrieved from http://www.ctan.org/tex-archive/ help/Catalogue/entries/graphicx.html
Voronkov, A. (2004). EasyChair conference system. Retrieved from easychair.org Voronkov, A. (2014). Keynote talk: EasyChair. In Proceeedings of the 29th ACM/IEEE International Conference on Automated Software Engineering (pp. 3-4). ACM.
Wikipedia. (n.d.). EasyChair. Retrieved from Wikipedia: https://en.wikipedia.org/wiki/EasyChair
