INTRODUCTION

The prediction of employee churn remains a major issue for most organizations globally. In this study, employee churn is defined as the loss of intellectual assets from a company [1]. Employees may decide to leave an organization for various reasons such as diss-atisfaction with salary, bureaucracy in the organization, or limited career growth [2]. However, the departure of skilled employees is detrimental and can lead to decreased productivity. The need for intelligent systems that can predict employee churn is apparent [3].
Human resources are considered the most valuable assets within an organization [4] and employee motivation is crucial in determining their continued stay. Organizations should go an extra mile to retain their manpower. However, it is hard to predict an employee’s plans to leave. To address the issue of employee retention, machine learning approaches can be used to analyse past employee data and identify patterns that predict the likelihood of employees leaving the organization [5]. In this study, we make a comparison to see which machine learning technique best predict employee churn. Past research has explored the use of machine learning techniques for employee churn prediction, but the full potential of feature engineering and selection has not been fully exploited. This study aims to fill that gap by developing an integrated supervised machine learning model [6] that compares multiple feature selection and data balancing methods to improve employee churn predictive accuracy [7]. The IBM dataset was chosen for this study as it encompasses common factors found in most sectors. The proposed machine learning model is envisaged to be able to identify the critical factors in retaining valuable employees and assist human resources managers in their staff retention efforts. Subsequent sections of the rest of this study cover related literature, a description of the data used, the methods followed in completing this study, the results, and the discussions thereto. We close the work with a conclusion which mainly presents our recommendations, contributions of the work, and the likely direction for future research.
DATA
The data used in the study was sampled from the IBM dataset which contains information about the employees such as personal details (name, employee ID, address, date of birth, and gender); contact
details such as email and phone number; employment information such as hire date, job title, and department; compensation and benefits such as salary, bonuses, and insurance; performance evaluations
such as reviews, ratings, and feedback; attendance and time off information such as sick leave, and vacation days; as well as education and training information, including degrees, certifications, and the courses taken. Initially the dataset had 35 features. However, 5 were removed due to redundancy, remaining with 30 features. Table 1 shows the 30 key features that were considered, along with the related data types.
Table 1. HR dataset features

METHODS
The steps involved in predicting employee churn included importing the IBM dataset into a Jupyter Notebook as the first step. Subsequently, exploratory data analysis was conducted to gain a deeper insight into the data. Oversampling was done to address the problem of imbalanced data. To proceed, 70% of the data was sampled into training data, while the remaining 30% was designated as testing
data. This ratio of 70/30 split was adopted based on research findings indicating optimal results [24]. Methods of feature selection, including Pearson correlation, Information gain, and Recursive feature elimination, were applied to identify the most crucial factors for prediction. Machine learning algorithms, including logistic regression, random forest, gradient boosting. decision trees, and K-nearest neigh-bour, were applied to each result of the feature selection methods. The accuracy, precision, recall, and F-Score of the algorithms were evaluated using test data for comparison. The machine learning algorithms were rerun on the data without the use of feature selection methods.
The classification results before and after feature selection were compared and the feature selection and classification approach with the highest accuracy and precision was selected. Finally, the key factors
affecting employee turnover were analysed and strategies for retaining employees were evaluated.

DATA IMBALANCES
The target variable data refers to the variable in a dataset that is being predicted or modelled. In this case, the target variable data is imbalanced, meaning that the distribution of the data between the
different classes is not equal. This can have negative effects on the performance of a machine learning model, as it can lead to decreased accuracy and bias towards the majority class. To mitigate these effects, two techniques were used to balance the data: Over-sampling and SMOTE. Over-sampling involves duplicating samples from the minority class to increase its representation in the dataset, while SMOTE (Synthetic Minority Over-sampling Technique) creates new synthetic samples for the minority class based on the existing samples that are closest to it in the feature domain. These techniques aim to balance the data, so that the machine learning model can be trained on more representative data and produce better results.
FEATURE SELECTION
In order to improve the prediction of employee turnover, the study used various feature selection methods to identify the most important features for the task. This preprocessing step is beneficial for a number of reasons, including improvement in performance, reduction of overfitting, and reduced computational costs. The study evaluated three different feature selection methods: Pearson Correlation, Information Gain, and Recursive Feature Elimination. Pearson Correlation (PC) selects features based on statistical measures and is known for its velocity and efficiency. Features with a correlation greater than 0.8 were removed, leaving only columns with a correlation below 0.8. After this, classification algorithms were applied to the feature subset. Information Gain (IG) evaluates the reduction of randomness in the data after transforming the dataset. It analyzes each feature's contribution to the target variable by calculating its information gain. The features were ranked by descending information gain and those with a threshold of 0.005 or
higher were included in the feature subset [26]. Again, classification algorithms were applied to this subset. Recursive Feature Elimination (RFE) is a feature selection method that iteratively measures feature importance and eliminates the least significant features [27]. The features were ranked by importance using the Random Forest (RF) method and the least important ones were removed until the desired number of features was reached. The RF-RFE algorithm was used to create the feature subset, followed by the implementation of classification algorithm.
CLASSIFICATION ALGORITHMS
The study utilized a diverse range of five classification algorithms to analyze the data. The first algorithm is Logistic Regression (LR), which is a statistical method for analyzing a dataset in which there
are one or more independent variables that determine an outcome. The second algorithm used is Random Forest (RF), which is an ensemble learning method for classification, regression and other tasks, that operate by constructing a multitude of decision trees at training time and outputting the class that is the mode of the classes (classification) or mean prediction (regression) of the individual trees. The third algorithm is Gradient Boosting Machine (GBM), which is a machine learning technique for regression and classification problems, which produces a prediction model in the form of an ensemble of weak prediction models, typically decision trees. The fourth algorithm used is Decision Tree (DT), which is a simple representation for classifying examples by recursively partitioning the feature space. The final algorithm applied is k-Nearest Neighbor (KNN), which is a non-parametric method used for classification and regression. The algorithm assumes that similar things exist in close proximity.
The Logistic Regression (LR) algorithm is a statistical technique used for binary classification, where the goal is to predict the probability of a categorical event happening (e.g., yes or no, true or false). The LR algorithm works by fitting a logistic function, also known as a sigmoid curve, to the data. The logistic function maps any real-valued number to a value between 0 and 1, which can then be interpreted as a probability value. In the context of LR, the logistic function represents the relationship between the input features and the binary outcome. By estimating the parameters of the logistic function using maximum likelihood estimation, the LR algorithm can produce a model that predicts the probability of the event of interest for any new observation. Here, x represents the value of the output.
𝑆(x)= 1
1+𝑒-x
An analysis of the relationship between the dependent variable and independent variables is carried out using this algorithm. To accomplish this, a line must be fitted and the error between the line and the data points must be minimized. Weighting factors define the importance of the predictors. The ease with which Logistic regression can be implemented and trained made it a suitable baseline model for the study.
A Random Forest (RF) is a predictive modeling technique that makes use of Decision Trees (DT) as its foundation. The advantage of this approach lies in its ability to mitigate overfitting, a common problem in machine learning, by aggregating the predictions from multiple trees rather than relying on the result from a single DT. This aggregation helps to reduce the variance in the predictions, leading
to improved performance compared to a single DT, while maintaining the same level of bias. In the model being described, all features were transformed into numerical values, after which the output
variable was predicted using the RF technique. The use of DTs as the basis for prediction in RF offers several benefits, including its ability to handle complex non-linear relationships between the input variables and the output variable, as well as its ability to handle large amounts of data and to handle missing data. In summary, RF is a powerful technique for predictive modeling that can significantly
improve the performance of a single DT by combining the results from multiple trees and reducing variance while maintaining bias. The conversion of all features to numeric values is an important step
in this process, as it enables the model to handle a wide range of data and make accurate predictions.
Gradient Boosting Machines (GBM) is a powerful machine learning technique that combines multiple weak learners to form a strong ensemble model. In GBM, the weak learners are combined iteratively
in a way that improves the overall accuracy of the model. The process of combining weak learners in GBM can be seen as an optimization problem, where the goal is to minimize the error rate of the ensemble model. This optimization is achieved through a gradient descent procedure, where the error rate is progressively and repeatedly reduced. In the study being described, all features were converted to numerical values, allowing the GBM algorithm to process the data and make predictions. The target variable in this study was "Attrition", which was predicted using the GBM technique. The ability of GBM to handle a wide range of data types and its ability to handle complex non-linear relationships between the input variables and the output variable make it a popular choice for predictive modeling. In summary, GBM is a powerful technique for predictive modeling that involves combining multiple weak learners to form a strong ensemble model. The optimization process used in GBM reduces the error rate of the model and improves its overall accuracy. The conversion of all features to numeric values is an important step in this process, as it enables the GBM algorithm to process the data and make accurate predictions.
Decision Trees (DT) are a widely used machine learning technique for data prediction and classification. They have a tree-like structure that can be easily visualized and understood, making them a popular
choice for both researchers and practitioners.. In a DT, every internal node represents a test on an attribute of the data, and every branch represents the outcome of that test. The leaf nodes of the tree
represent the class labels of the data. This flowchart-like layout makes it easy to understand how the model arrived at its predictions and can help in interpreting the results. DTs are effective for both
regression and classification problems, and they can handle both continuous and categorical data. They are particularly useful for dealing with complex non-linear relationships between the input variables and the output variable. DTs can also handle large amounts of data and can handle missing data effectively. In summary, DTs are a powerful technique for data prediction and classification that can handle complex relationships between the input variables and the output variable. The tree-like structure of DTs makes them easy to understand and interpret, and they can handle a wide range of data types and missing data.
K-Nearest Neighbors (KNN) is a popular machine learning algorithm used for binary classification tasks. In KNN, data points are classified based on the class of their nearest neighbors. The number of neighbors considered is specified by the user and is represented by the parameter "k". To determine the nearest neighbors, a distance measure is used. The most common distance measure used in KNN
is the Euclidean distance, which calculates the straight-line distance between two points in a multidimensional space. This distance is calculated for each instance in the dataset, and the k instances with
the smallest distances are identified as the nearest neighbors. Once the nearest neighbors have been identified, the unlabeled instances are classified based on the majority class of their k-nearest neighbors. If k is set to 3 and 2 out of the 3 nearest neighbors belong to class A and 1 belongs to class B, the unlabeled instance will be classified as belonging to class A. This process is repeated for all instances in the dataset, and the resulting classifications form the output of the KNN algorithm. In conclusion, KNN is a simple and effective method for binary classification tasks, as it makes use of the class information of nearby instances to make predictions. By using the Euclidean distance and a specified value of k, KNN is able to effectively classify new, unlabeled instances.
RESULTS
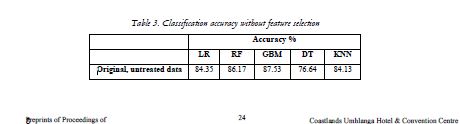
To evaluate the various strategies, the feature selection techniques and corresponding algorithms were executed and the results of their accuracy were summarized in Table 2. The purpose of comparing the
different approaches was to determine which method performed the best in terms of accuracy. The feature selection methods used were applied to identify the most important features in the data set, which then served as inputs for the relevant algorithms. The accuracy scores of the algorithms were recorded and presented in Table 2 for easy comparison and analysis. This helped to determine the most effective combination of feature selection and algorithm for the specific problem at hand.
In addition to evaluating the performance of the algorithms with the use of feature selection methods, the algorithms were also tested without these methods to compare the results. The accuracy scores of the algorithms in this scenario were recorded and presented in Table 3. The purpose of this comparison was to determine if feature selection improved the accuracy of the algorithms, or if the algorithms could produce acceptable results without it. By presenting the accuracy scores without feature selection in Table 3, a clearer understanding
of the impact of feature selection on the performance of the algorithms could be obtained. This information would then inform the decision of whether or not to use feature selection in a given scenario.
When analyzing Table 2 and Table 3, it becomes evident that the accuracy of the results continually improves with the use of feature selection methods. One method in particular, Pearson Correlation,
stood out as being particularly effective, resulting in a significant increase in accuracy when compared to other methods. Out of all the classification techniques used, the Random Forest (RF) Classifier
demonstrated the highest accuracy, showing a 6.84% improvement when Pearson Correlation was employed. The accuracy of the Gradient Boosting Machine (GBM) also saw an improvement of 4.52%, while the decision tree (DT) method showed a 7.2% increase. The k-Nearest Neighbors (KNN) method saw a 5.21% increase in accuracy, and the Logistic Regression (LR) method had the largest improvement of all, with an 8.61% increase in accuracy.
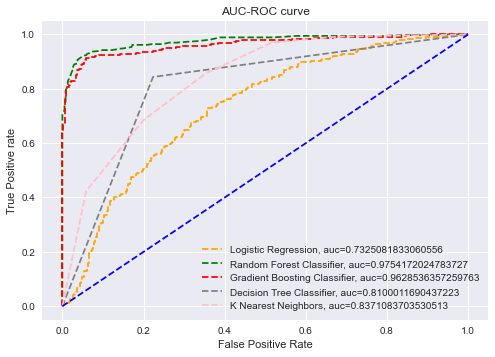
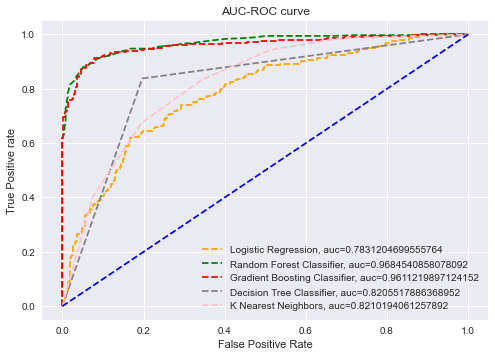
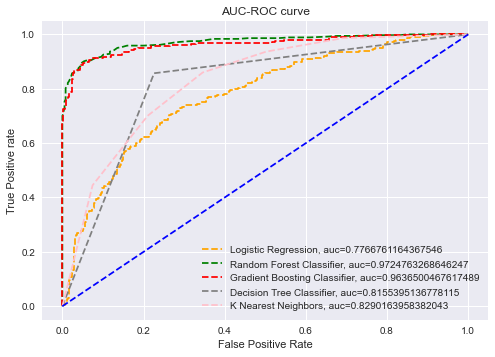
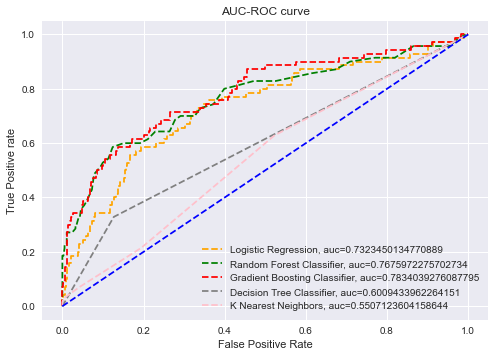
To evaluate the performance of different classification thresholds, Receiver Operating Characteristic (ROC) curves are utilized, and the Area Under the ROC Curve (AUC-ROC) is calculated both with
and without feature selection. The AUC-ROC summarizes the results of each threshold's confusion matrix, and a high AUC (close to 1) indicates that the model is highly separable. The closer the AUC is
to 1, the better the model's performance. The results showed that the AUC-ROC of the Gradient Boosting Machine (GBM) and Random Forest (RF) algorithms was higher than the other algorithms in all cases, implying that the two ensemble algorithms are superior models. The AUC-ROC graph clearly indicates that GBM and RF are strong models, with AUC values close to 1, particularly when Pearson Correlation is used for feature selection. The ROC curves for the different algorithms are presented below.
A Machine Learning Model to Forecast Employee Churn for HR Analytics.

CONCLUSION
The purpose of the study was to build a supervised machine learning model for employee attrition prediction. To do this, the study compared the performance of five different algorithms: Logistic Regression (LR), Random Forest (RF), Gradient Boosting Machine (GBM), Decision Tree (DT), and KNearest Neighbours (KNN). These algorithms were evaluated both with and without feature selection to determine the impact of feature selection on each algorithm performance. The results of the study showed that the Random Forest (RF) model had the highest accuracy and AUC (Area Under the Curve) when compared to the other algorithms. On the other hand, the Gradient Boosting Machine (GBM) model performed the best on untreated data. The study also found that ensemble algorithms (algorithms that make predictions by combining the outputs of multiple models) showed greater predictive power. In terms of feature selection, the results showed that it improved the performance of the algorithms. The study found that the Pearson Correlation method was the most effective feature selection technique. The study concluded that the employee attrition prediction model built using machine learning can assist management in developing effective retention strategies. The results of this study
suggest that future studies should explore the use of unsupervised machine learning and deep learning techniques for employee attrition prediction.
ACKNOWLEDGEMENTS
We acknowledge both the moral and technical support given by colleagues at the Sol Plaatje University, Department of Computer Science, Data Science, and Information Technology. This research
was also partly funded through an ABSA research grant and the CAIR (Centre for Artificial Intelligence Research) fund, grant agreement number: CSIR/BEI/HNP/CAIR/2020/10, supported by the Government of the Republic of South Africa, through its Department of Science
and Innovation (DSI).
REFERENCES
1. R. K. Pradhan, L. K. Jena and R. Pattnaik, “Employee Retention Strategies in Service Industries: Opportunities and Challenges,” Employees and Employers in Service Organizations, Apple Academic Press, 2017, pp 53-70.
2. A. Khaled, Z. Safeya, A. Abdullah and T. M. Usmani, “Employee Retention Prediction in Corporate Organizations using Machine Learning Methods,” Academy of Entrepreneurship Journal, vol.27, 2021, pp 3-4.
3. Z. Xiaojuan, "Forecasting Employee Turnover in Large Organizations. " PhD diss., University of Tennessee, 2016.
4. I. Fulmer, R. Ployhart, “Our Most Important Asset”, Journal of Management, vol.40, 2013, pp 2-3
5. A. Reyes, C. Aquino, D. C. Bueno, “Why Employees Leave: Factors that Stimulate Resignation Resulting in Creative Retention Ideas”,Researchgate Publication, 2019, pp7-8.
6. A. Raza, “Predicting Employee Attrition Using Machine Learning Approaches”, vol.12, Applied Sci. Journal, 2022.
7. A. Omar, F Hossam, J Khalid, H Osama and N. Ghatasheh,“Predicting customer churn in telecom industry using multilayer preceptron neural networks: modeling and analysis”, vol.11(3), Life Science Journal, 2014, pp 23-24.
8. V.Umayaparvathi and K Iyakutti, “A survey on customer churn prediction in telecom industry: datasets, methods and metric”,vol.3, IRJET, 2016, pp 12-16.
9. A. Amin , S. Anwar, A. Adnan, M. Nawaz, N. Howard, J. Qadir, A. Hawalah, A. Hussain, “ Comparing oversampling techniques to handle the class imbalance problem: a customer churn prediction case study”, vol. 4, IEEE Access, 2016, pp.7940-7957.
10. A. Hebbar, P. Sanath, S. Rajeshwari, S Saqquaf, “Comparison of Machine Learning Techniques to Predict the Attrition Rate of the Employees”, 3rd IEEE International Conference on Recent Trends in Electronics, Information and Communication Technology, May 2018, pp 934-938.
11. R. V. Dam, “Predicting Employee Attrition”, Masters Thesis, University of Tilburg, 2021.
12. Y. Zhao, M. Hryniewicki, F. Cheng, B.Fu and X. Zhu, “Employee Turnover Prediction with Machine Learning: A Reliable Approach”, PhD diss, University of Toronto, 2019.
13. R. Punnoose and P. Ajit, “Prediction of employee turnover in organizations using machine learning algorithms”, International Journal of Advanced Research in Artificial Intelligence, vol. 5 Issue 9, October 2016, pp 32-33.
14. N. El-Rayes, M. Fang, M. Smith and S. Taylor, “Predicting employee attrition using tree based models”, International Journal of Organizational Analysis, vol 28, pp 33-36, 2020.
15. I. Yigit and H. Sourabizadeh, “An Approach for Predicting Employee Churn by Using Data Mining”, IEEE, 2017.16. F. Falluchi, M. Codalangelo, R. Giuliano and L. William, “Predicitng Employee Attrition Using Machine Learning Techniques”, Computers Journal, vol.9, 2020.
17. X. Ying, “An Overview of Overfitting and its Solutions”, IOP Publishing, vol.1168, No.2, 2022.
18. G. Gabrani and A. Kwatra, “Machine Learning Based Predictive Model for Risk Assessment of Employee Attrition”, Computational Science and Its Applications,Springer International Publishing, 2018.
19. V. Saradhi and G. K. Palshikar, “Employee churn prediction,” Expert Sys. with Applications, vol. 38, no. 3. 2011
20. Khare, R. Kaloya ,D. Choudhary, CK and Gupta, G. “Employee attrition risk assessment using logistic regression
analysis,” Computational Science and Its Applications, vol. 34, 2013.
21. M. Basha, D. S. Rajput, V. Vandhan, “Impact of Gradient Ascent and Boosting Algorithm in Classification”, International
Journal of Intelligent Engineering Systems, vol.11, February 2018.
22. S. Sisodia, S. Vishwakarma and A. Pujahari, “Evaluation of machine learning models for employee churn prediction”,
International Conference on Inventive Computing and Informatics (ICICI) (pp. 1016-1020), IEEE, 2017
23. M. Tharani and V. Raj, “Predicting employee turnover intention in itites industry using machine learning algorithms”,
Fourth International Conference on I-SMAC (IoT in Social, Mobile, Analytics and Cloud), 2020.
24. A. Gholamy, V. Kreinovich and O. Kesheleva, “Why 70/30 or 80/20 Relation Between Training and Testing Sets:
A Pedagogical Explanation”, Technical Report: UTEP-CS-18-09, University of Texas, February, 2018.
25. B. Pranto, “Entroppy Calculation, Information Gain & Decision Tree Learning”, https://medium.com/analyticsvidhya/
entropy-calculation-information-gain-decision-tree-learning 771325d16f. Accessed 20 August 2022.
26. A. Gupta, “Feature Selection Techniques in Machine Learning”, https://www.analyticsvidhya.com/blog/2020/10/feature-selection-techniques-in-machine-learning/. Accessed 20 August 2022.
27. N. V. Sharma and N. S. Yadav, “An optimal intrusion detection system using recursive feature elimination and ensemble of classifiers”, Microprocessors and Microsystems Journal, vol. 85, 2021
28. I. Guyon, J. Weston, S. Barnhill and V. Vapnik, “Gene selection for cancer classification using support vector machines”, Machine Learning, vol 46, issue1/3, pp 389-422, 2018.
29. T.W. Edgar and D.O. Manz, “Research Methods for Cyber Security”, Science Direct Publishers, 2017, pp 36-38.
30. G. James, D. Witten, T. Hastie and R. Tibshirani, “An introduction to statistical learning”, Springer 2018,
31. S. Han, H. Kim and Y.S. Lee, “Double random forest”, Mach Learn vol 109, 2020, pp12-13.
32. [35] E. Scornet, “Trees, Forests and Impurity-based Variable Importance”, HAL Open Science, 2020, pp 10-11.
33. M. Chen, Q. Liu, S. Chen, Y. Liu, C. H. Zhang and R. Liu, “ XGBoost-Based Algorithm Interpretation and Application
on Post-Fault Transient Stability Status Prediction of Power System”, IEEE Access, 7, 13149–13158. https://doi.org/10.1109/access.2019.2893448.
34. J. Han, J Pei, M. Kamber, “Data Mining: Concepts and Techniques”, Morgan Kaufmann Publishers, 2011.
35. S. Zhang, X. Li, M. Zong, Z. Ming and D. Cheng, “Learning k for kNN Classification”, ACM Transactions on
Intelligent Systems and Technology, ResearchGate, 2017, pp 7-8.
36. D. Subramanian, “A Simple Introduction to K-Nearest Neighbors Algorithm”, ScienceDirect Publishers, 2019.
37. L. Y. Hu, M.W. Huang, S.W. Ke, “The distance function effect on k-nearest neighbor classification for medical datasets”, SpringerPlus, vol 5, 2016.
